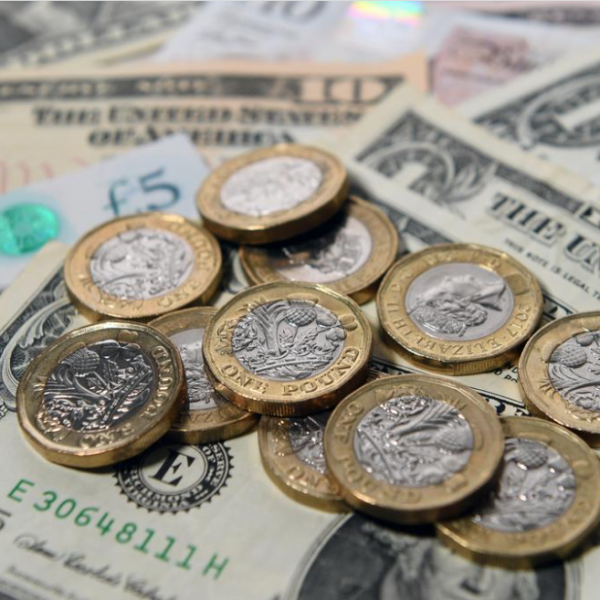
During the European session on Wednesday, the Pound Sterling (GBP) temporarily bounces back above the 1.2500 handle against the US Dollar (USD). The main event risk on the horizon for GBP/USD is the Federal Reserve (Fed) monetary policy meeting, with the Federal Open Market Committee (FOMC) deciding the Fed Funds Rate. The FOMC meeting will conclude at 18:00 GMT and will likely inject some volatility into US Dollar pairs.
From a technical perspective, GBP/USD continues to trade in a range within a broader bullish trend which began ever since the printing of the September lows. Longs are, therefore, favored over shorts.
GBP/USD market movers
- Market expectations have crystallized for a 25 bps interest rate hike by the Federal Reserve (Fed) at its FOMC meeting on Wednesday.
- According to Feds Funds Futures data, the probabilities for a quarter percent hike now stand at 87% – slightly down from Tuesday’s 97% but still relatively high.
- Higher-than-expected PCE inflation data – the Federal Reserve’s preferred inflation gauge – reflected in last week’s data showed prices remain sticky in the United States, further suggesting the Fed needs to continue hiking rates.
- Banking crisis fears, partly due to the stress put on regional banks by the impact of higher interest rates on the US Treasury bond market, are viewed as a further counterargument to the Fed hiking rates.
- The US Dollar may see fluctuations depending on the tone of the Fed’s accompanying policy statement, especially if it suggests May’s hike is a ‘one and done’.
- There is a small chance the Fed may not hike at all if it assesses the risks to the banking system are still too great.
- That said, GBP is supported after data for March continued to show UK inflation above 10% for the seventh consecutive month.
- This suggests the Bank of England (BoE) is far from done with hiking interest rates in the UK and may have to hike more than once to get inflation back under control. If so, this is a medium-term bullish factor for Pound Sterling.
- GBP also gains underpinning support from a 0.5% MoM rise in UK house prices in April when a negative figure had been expected, according to data provided by the UK’s biggest mortgage lender, Nationwide.
- Data from the Commodity Futures Trading Commission (CFTC) shows speculative investor flows have become increasingly supportive of the Pound Sterling over recent weeks, with non-commercial traders increasing their long bets above those of commercial traders who have been increasing short bets.
- JOLTS Job Openings data for March weighed on the US Dollar, on Tuesday, after showing an unexpected fall in openings to 9.59M when 9.78M had been expected and 9.97M noted in February. Cracks in the job market are the first sign of a recession.
GBP/USD technical analysis: Sideways in an Uptrend
GBP/USD has been in an extended sideways range within a broader uptrend that began at the September 2022 lows. Despite recent volatile ups and downs, the pair made new highs in the upper 1.25s in late April, and the overall trend remains marginally bullish. Thus, Pound Sterling longs are favored over shorts.
A two-bar bearish reversal pattern formed at the recent highs on April 28 and May 1. Two-bar reversals are fairly reliable patterns. A long green, full-bodied candle that makes new highs is immediately followed by a long red-down candle of a similar length – as happened on Friday, April 28 and Monday, May 1.
The pattern was followed by a bearish day on Tuesday, May 2 and dependent on other factors, such as the outcome of the FOMC meeting, could signal further downside. Two-bar reversals, however, are only very short-term bearish signals.
If more downside follows, it could see GBP/USD retest the 1.2350 April-range lows.
Given the dominant trend remains bullish-to-sideways, however, pressure to the upside is likely to re-emerge eventually and could see the price recover and rally before breaking to fresh highs. Depending on Wednesday’s Federal Reserve meeting outcome, this may happen sooner than expected.
If Pound Sterling bulls take over again, a decisive break above the year-to-date 1.2583 highs of April 28 would probably lead to a continuation higher to the next key resistance level at circa 1.2680.
Decisive breaks are usually characterized by moves that begin with a strong green daily bar that breaks above the ceiling level or key high, with the price closing near the day’s highs. Alternatively, three consecutive green bars above the ceiling can confirm breakouts. Such insignia confirm that the break is not a ‘false break’ or bull trap.

