Asia-Pacific Market Briefing – Bank and Crypto Woes Drive Volatility
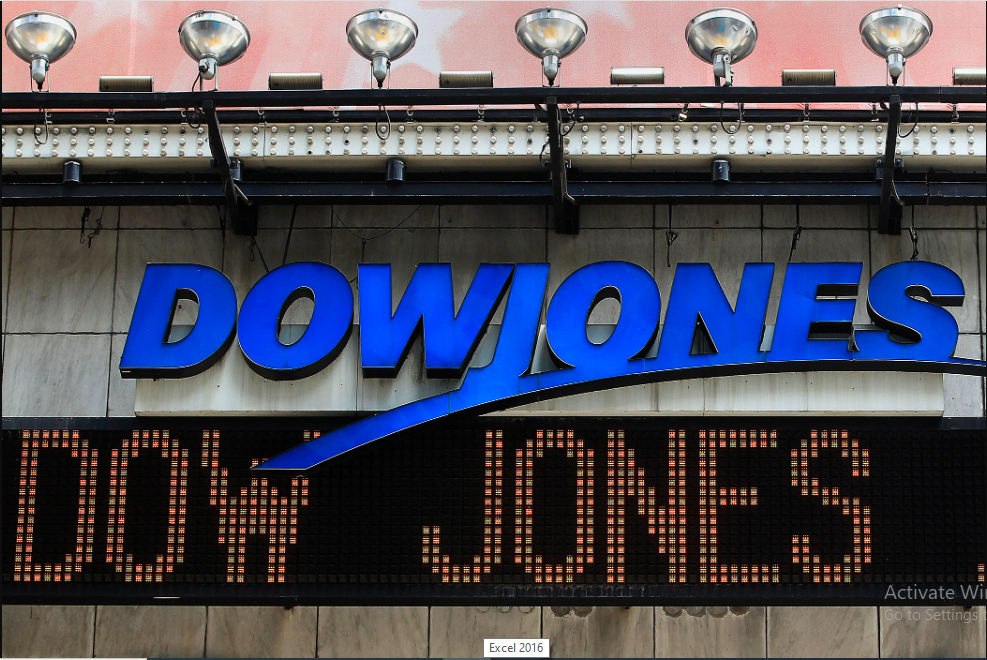
Dow Jones futures sank 1.69% on Thursday as risk aversion struck Wall Street. The S&P 500 and Nasdaq 100 also did not fare well, dropping 1.85% and 2.05%, respectively. The VIX market ‘fear gauge’ soared 18.32% in the best single-day performance since June 2022. Traders fled for safety, buying up Treasuries and pushing up prices as yields fell.
The source of fear could be traced to the banking sector. Fears about contagion arose after SVB Financial Group plunged 60.41% one day after announcing a USD 1.75 billion share sale. According to Bloomberg, this was done to help shore up capital after being hit by losses on security portfolios and a slowdown in funding at venture capital-backed firms it banks with.
Following a historical period of cheap capital and rock-bottom interest rates to combat Covid, rapidly tightening credit conditions have drawn capital and interest out of the riskiest investment propositions. Another side effect is that your average consumer now has access to the highest ‘risk-free’ interest rates and CDs, making investing in equities less appealing.
Another corner of the market has also been struggling – cryptocurrencies. Bitcoin fell 6.14% on Thursday, the most since November. This was a day after crypto-specialized bank Silvergate Capital Corp. said it would be winding down operations. The company’s stock plunged over 98% since topping at a high of 239.26 back in November 2021.
Put together; this is setting up Asia-Pacific markets, bracing for volatility as we wrap up this week. There is plenty of event risk left as well. Later today, the Bank of Japan will announce its latest monetary policy announcement. Traders will be looking for clues about what could happen to yield curve control later this year. Then during the Wall Street trading session, all eyes will turn to the next non-farm payrolls report.
Dow Jones Technical Analysis
On the daily chart, the Dow Jones broke under the 38.2% Fibonacci retracement level at 32709, further pushing below a Symmetrical Triangle chart formation. This is now placing the focus on the 31738 – 32017 support zone. Meanwhile, the 50-day Simple Moving Average (SMA) continues to guide prices lower, offering a key point of resistance in the event of a turn higher.


This Post Has One Comment
Thank you for your sharing. I am worried that I lack creative ideas. It is your article that makes me full of hope. Thank you. But, I have a question, can you help me?