

Here is a breakdown of our weekly FX price analysis.
GBP/JPY
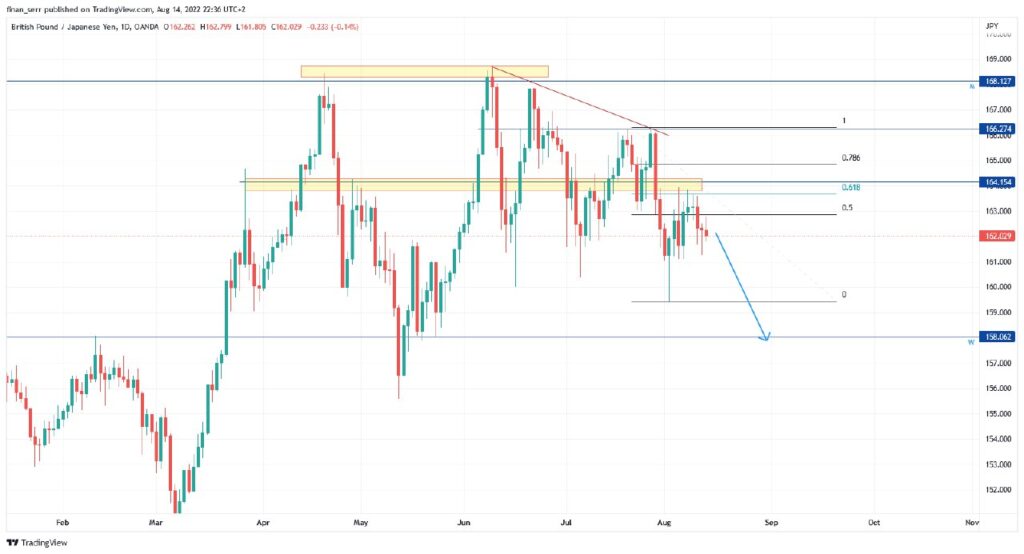
As we predicted and consequently anticipated last week, the currency pair hit the previous support, which now acts as resistance around the 164.15 area. Currently, the trend is strongly bearish, and we anticipate even more price free-fall this week. GBP/JPY is predicted to test the 158 area later in the week.
GBP/JPY Price Chart
EUR/JPY
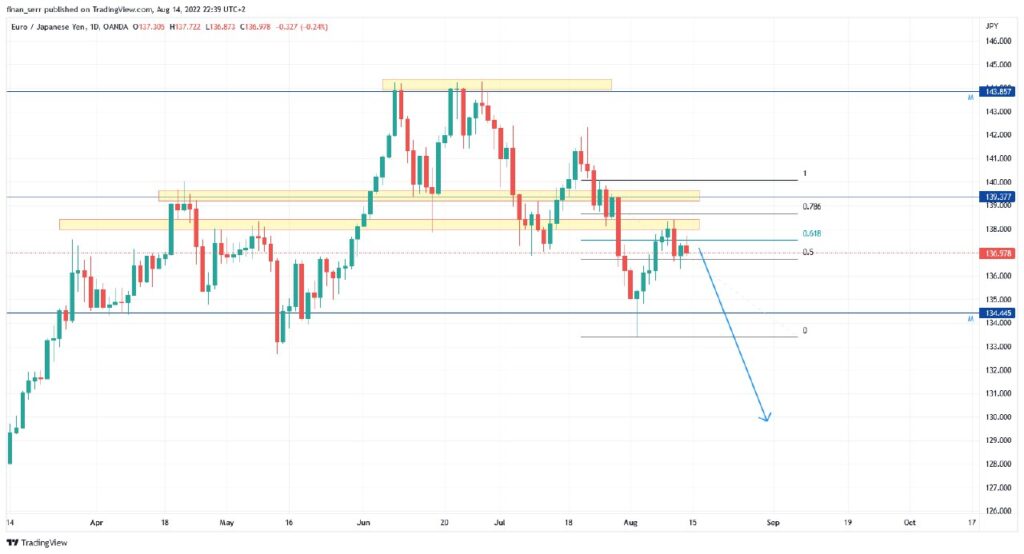
EUR/JPY also has a similar structure to EUR/JPY. The former support of this currency pair, around 138.50, now acts as resistance. But unlike EUR/JPY, the price is holding in this area. However, later in the week, we should expect a price test around 133/133.50 as the currency pair continues its bearish trend.
EUR/JPY Price Chart
NZD/CHF
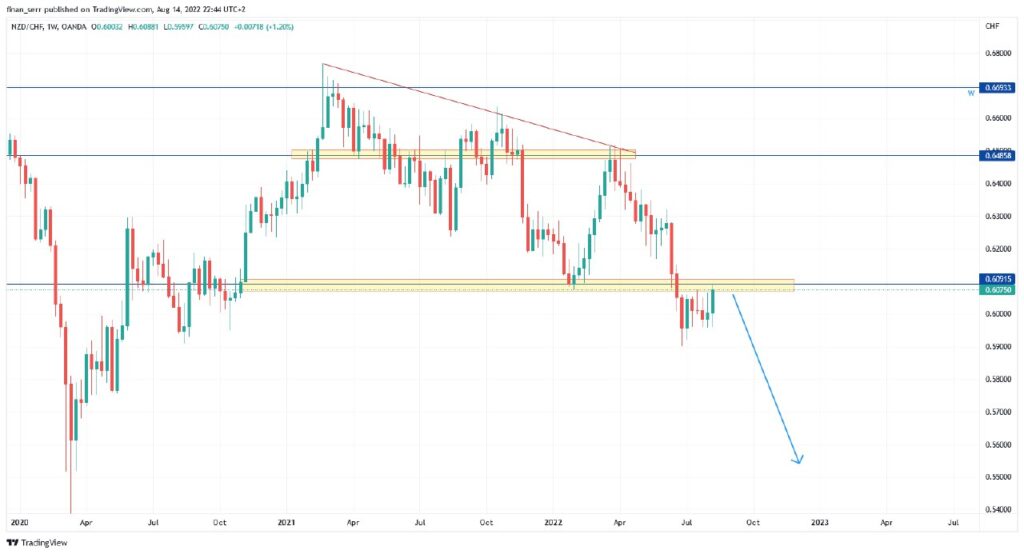
The NZD/CHF price action is a clear pictorial representation of what testing former support, which now acts as a resistance, looks like. For this pair, the trend is also down, although sometimes last week, the market experienced a price retracement to the 0.6100 area. Trade With Mac firmly believes that this level will hold. However, it is advised to watch price behavior at its current price keenly and, more importantly, be prepared to sell upon confirmation.
NZD/CHF Price Chart
Gold
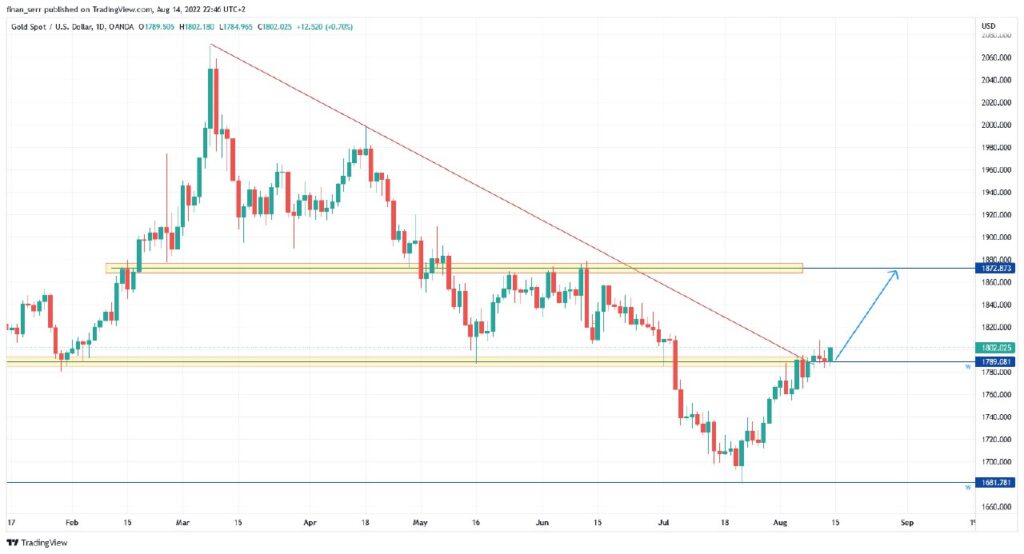
Gold continues its steady uptrend behavior from last week. Last week, we saw a price break the falling trendline which translates that the bears are losing steam. Also, the confluence of the falling trendline and former support that currently acts as resistance has been broken.
This week, we’ll be waiting for a retest of the 1790 area for a buy confirmation.
Gold Price Chart
Are you interested in receiving real-time Forex Trading Signals Directly To Your Phone?
Don’t hesitate to subscribe to my VIP Forex Trading Signals Today.
This Post Has 150 Comments
Excellent blog! Do you have any tips for aspiring writers?
I’m hoping to start my own website soon but I’m a little lost on everything.
Would you suggest starting with a free platform like
Wordpress or go for a paid option? There are so many options out there that I’m
completely confused .. Any recommendations? Many thanks!
Unquestionably consider that that you stated. Your favorite justification appeared to be at the
web the simplest thing to take into accout of. I say to you, I certainly get annoyed whilst folks think about issues that they
just don’t know about. You managed to hit the nail upon the
highest as smartly as defined out the whole thing without having side effect ,
people could take a signal. Will likely be back to get more.
Thank you
Hi there! This blog post could not be written any better!
Going through this article reminds me of my previous
roommate! He continually kept preaching about
this. I am going to forward this information to him.
Pretty sure he will have a good read. I appreciate you for sharing!
Уважаемые эксперты по мобильным прокси в Узбекистане, подскажите http://damienqjnc266.theburnward.com/kupit-mobilnye-proksi-ipv4-bystraa-i-stabilnaa-internet-svaz-garantirovana
BYD Chazor имеет вместительный багажник и роскошный дизайн для ценителей https://pixabay.com/users/ruvornoyuc-42697418/
Стоматологическая клиника в Ташкенте предоставляет услуги по лечению и профилактике заболеваний, связанных с эндокринной системой https://www.pexels.com/@estelle-lynch-875279933/
negative quality company<br piss test
bad high quality service<br worst quality
Thanks for the great information. More at μεζεδοπωλεια μοναστηρακι ψυρρη
Appreciate the insightful article. Find more at παραδοσιακή ελληνική κουζίνα ψυρρή
terrible quality item<br return my money
This was very well put together. Discover more at https://victoriannailsandspa.com/
This was quite informative. For more, visit traditional greek tavern near me
lousy excellent service<br bitch slap
Thanks for the thorough analysis. Find more at https://thenailstop.net/
Thanks for the detailed guidance. More at Check out this site
Thanks for the clear breakdown. Find more at https://nixanailsmo.com/
I enjoyed this article. Check out Αισώπου Μύθοι τα καλυτερα μεζεδοπωλεια ψυρρη for more
Dont purchase anything from right here poor quality
Thanks for the great explanation. Find more at Aesopou Fables traditional greek tavern monastiraki
Appreciate the thorough insights. For more, visit Baji Bagh
Nicely detailed. Discover more at Additional hints
terrible high-quality services<br bad quality
Tại Tâm Beauty Clinic, chúng tôi xuất bản các nội dung đánh giá, bảng xếp hạng liên quan đến ngành làm đẹp, bao gồm các spa trị mụn, spa làm đẹp, spa dưỡng da,… Mỗi thương hiệu được đưa vào bảng xếp hạng đều trải qua quá trình sàng lọc kỹ lưỡng https://tambeautyclinic.vn
Very nice site it would be nice if you check get more info
Appreciate the great suggestions. For more, visit home renovation
This was a great article. Check out μεζεδοπωλεια ψυρρή for more
yararlı tavsiyeler için teşekkürler. https://www.karelservis.com.tr/ adresinde daha fazlasını keşfedin
I enjoyed this article. Check out Αισώπου Μύθοι μεζεδοπωλεια αθηνα ψυρρη for more
Great insights! Discover more at home renovation in Toronto
Thanks for the great information. More at traditional greek tavern near me
Appreciate the useful tips. For more, visit home renovation Toronto
¿Qué opinas del mejor concurso SEO: https://www.desdesoria.es/articulo/reportajes/entrega-premios-vocacion-digital-raiola-sera-15-julio/20240523232647797424.html ? ¿Estás particip
I enjoyed this article. Check out what is cryptocurrency for more
Avage AI: Transforme Sua Estratégia de Trading no Brasil
Avage AI é uma aplicação de trading avançada, projetada especialmente para o mercado brasileiro Sign Up
Great insights! Discover more at seo autopilot neo
Властелин колец: Братство кольца (2001): Эпический фэнтезийный триллер, потрясающий баланс сюжета и визуальных эффектов https://tempaste.com/Aj2U2U3UyF8
Great job! Discover more at Sugarplay
I found this very interesting. For more, visit easy home improvement hacks
Great Discover more here
Great work! This is the kind of info that should be shared
around the web. Shame on the search engines for now
not positioning this post upper! Come on over and consult with
my site . Thank you =)
all the time i used to read smaller posts that as well clear their motive,
and that is also happening with this post which I am reading now.
Wow, awesome blog layout! How long have you been blogging for?
you make blogging look easy. The overall look of your web site is wonderful, let
alone the content!
Hello! Someone in my Myspace group shared this site with us so I came to give
it a look. I’m definitely loving the information. I’m book-marking and will be tweeting this to my followers!
Excellent blog and amazing style and design.
Awesome blog! Do you have any tips for aspiring writers? I’m hoping to start my own site
soon but I’m a little lost on everything. Would you suggest
starting with a free platform like WordPress or go for a paid
option? There are so many choices out there that I’m completely overwhelmed ..
Any suggestions? Cheers!
Useful information. Fortunate me I found your
web site accidentally, and I’m stunned why this twist of fate didn’t took place earlier!
I bookmarked it.
Pretty nice post. I just stumbled upon your blog and
wished to say that I’ve really enjoyed browsing your blog posts.
In any case I’ll be subscribing to your feed and I hope you write
again soon!
Since the admin of this site is working, no hesitation very
shortly it will be well-known, due to its quality contents.
Wonderful goods from you, man. I have take into account your stuff previous to and you are simply extremely wonderful.
I really like what you’ve acquired right here, certainly
like what you’re saying and the way in which during which you assert it.
You’re making it enjoyable and you continue to take care of to keep it sensible.
I can’t wait to read far more from you. This is really a great site.
Good article! We are linking to this great content on our site.
Keep up the great writing.
Wow, fantastic blog format! How lengthy have you ever been running a
blog for? you make running a blog look easy. The whole look of your web site is fantastic, as well as the content!
You need to take part in a contest for one of the highest quality blogs on the web.
I am going to recommend this site!
It’s very straightforward to find out any matter on web
as compared to books, as I found this paragraph at this web page.
Hmm is anyone else encountering problems with the images on this blog loading?
I’m trying to find out if its a problem on my end or if it’s the blog.
Any responses would be greatly appreciated.
Excellent blog here! Also your web site loads
up fast! What host are you the usage of? Can I am getting your associate hyperlink on your host?
I wish my web site loaded up as fast as yours lol
Hi there, I enjoy reading through your post. I like to
write a little comment to support you.
Hi, i read your blog from time to time and i own a similar one and i was just curious if you get a
lot of spam responses? If so how do you reduce it, any plugin or anything you
can advise? I get so much lately it’s driving me crazy so any support is very much
appreciated.
Normally I don’t learn post on blogs, but I wish to say that this write-up very pressured me to
try and do it! Your writing taste has been surprised me.
Thank you, quite great post.
I know this if off topic but I’m looking into starting
my own weblog and was wondering what all is needed to get set up?
I’m assuming having a blog like yours would cost a pretty penny?
I’m not very internet smart so I’m not 100% positive.
Any recommendations or advice would be greatly appreciated.
Kudos
It’s remarkable in support of me to have a website, which
is good in support of my know-how. thanks admin
I have learn a few just right stuff here. Certainly value bookmarking for revisiting.
I wonder how much attempt you set to create the sort of great informative
site.
Heya i’m for the first time here. I found this board and I find It really useful & it
helped me out much. I hope to give something
back and help others like you aided me.
We’re a group of volunteers and starting a new scheme in our community.
Your web site offered us with valuable info to work on. You’ve done an impressive
job and our entire community will be grateful to you.
Great blog here! Also your site loads up very fast! What web host
are you using? Can I get your affiliate link to your host?
I wish my site loaded up as fast as yours lol
I’m not sure why but this site is loading extremely slow
for me. Is anyone else having this problem or is it a issue on my end?
I’ll check back later on and see if the problem still exists.
Hello there! Quick question that’s entirely off topic.
Do you know how to make your site mobile friendly?
My web site looks weird when browsing from my iphone.
I’m trying to find a theme or plugin that
might be able to resolve this issue. If you have any suggestions, please share.
With thanks!
I must thank you for the efforts you have put in writing
this site. I am hoping to see the same high-grade blog posts
from you in the future as well. In fact, your creative writing abilities has encouraged me to
get my own, personal blog now 😉
I am regular reader, how are you everybody? This post
posted at this web site is in fact good.
It’s going to be end of mine day, however before end I
am reading this enormous post to increase
my experience.
Hello would you mind stating which blog platform you’re working with?
I’m going to start my own blog soon but I’m having a tough time
making a decision between BlogEngine/Wordpress/B2evolution and Drupal.
The reason I ask is because your design seems different then most
blogs and I’m looking for something completely unique.
P.S Sorry for getting off-topic but I had to ask!
Hello, i think that i saw you visited my web site
thus i came to “return the favor”.I’m attempting to find things to enhance my website!I suppose its ok to use some of your ideas!!
I just like the valuable info you provide for your articles.
I’ll bookmark your blog and check once more here frequently.
I am slightly certain I will be told a lot of new stuff right right here!
Good luck for the next!
Having read this I thought it was extremely enlightening.
I appreciate you spending some time and energy to put this short article together.
I once again find myself spending a lot of time both reading and leaving comments.
But so what, it was still worth it!
Hi, i think that i saw you visited my weblog so i came to “return the favor”.I
am trying to find things to enhance my site!I suppose its ok to use some of your ideas!!
It’s amazing in support of me to have a web page, which is helpful in favor
of my know-how. thanks admin
Very shortly this web page will be famous among all blogging
and site-building users, due to it’s good content
I blog quite often and I really appreciate your content.
This article has really peaked my interest. I will take a note of your site and keep checking for new information about once per week.
I opted in for your Feed too.
Казино Ап Икс стало моим любимым.
If you are going for most excellent contents like myself, simply pay a quick visit this web site all
the time for the reason that it offers quality contents, thanks
It’s a pity you don’t have a donate button! I’d certainly donate to this excellent blog!
I suppose for now i’ll settle for bookmarking and adding your RSS feed to my Google account.
I look forward to new updates and will share this site with my
Facebook group. Chat soon!
Piece of writing writing is also a excitement, if you
be familiar with afterward you can write or else it
is complicated to write.
Здесь активное комьюнити, в турнирах участвуют тысячи пользователей.
Ponadto platforma mobilna oferuje bezpieczne i bezpieczne wrażenia z gry dzięki najnowszej technologii szyfrowania SSL.
I don’t even know the way I stopped up right here, however I believed this publish used to be good.
I do not know who you’re but definitely you are going to a well-known blogger for those
who aren’t already. Cheers!
Howdy! This post couldn’t be written much better!
Going through this article reminds me of my previous roommate!
He always kept preaching about this. I most certainly will forward this information to
him. Pretty sure he’ll have a great read. Thanks for sharing!
You actually make it appear so easy along with your presentation but
I find this matter to be actually something which I feel I’d by no means understand.
It seems too complicated and very huge for me. I am looking forward on your subsequent post, I’ll attempt to get the hang of it!
Nice response in return of this query with solid arguments and explaining all on the topic of that.
Its like you read my mind! You seem to know so much about this, like you wrote the book in it or something.
I think that you could do with a few pics to drive the message home a bit, but other than that, this is fantastic blog.
A great read. I’ll certainly be back.
It’s not my first time to pay a visit this website, i am browsing this web page dailly
and get good facts from here everyday.
Hi, after reading this amazing article i am also cheerful to share my knowledge here with colleagues.
If you want to improve your knowledge only keep visiting this site and be updated with the newest news posted here.
Hi there, I enjoy reading all of your article.
I like to write a little comment to support you.
It’s wonderful that you are getting ideas from this post as
well as from our argument made at this place.
I’m amazed, I must say. Rarely do I come across a blog that’s both educative and entertaining,
and let me tell you, you have hit the nail on the head.
The problem is an issue that not enough men and women are speaking intelligently about.
Now i’m very happy I stumbled across this in my hunt for something concerning this.
Very quickly this web site will be famous among all
blogging viewers, due to it’s pleasant content
After checking out a number of the blog posts on your website, I truly appreciate your
way of writing a blog. I book-marked it to my bookmark site list and will be checking back in the near future.
Please check out my website as well and let me know how
you feel.
It’s nearly impossible to find educated people about this topic, but you sound like you know what you’re talking about!
Thanks
WOW just what I was searching for. Came here by searching for
joker123 deposit pulsa 10rb
Fantastic website. A lot of useful info here. I’m sending it
to several pals ans also sharing in delicious.
And naturally, thanks on your sweat!
Heya! I just wanted to ask if you ever have any problems with hackers?
My last blog (wordpress) was hacked and I ended up losing months of hard work due
to no back up. Do you have any solutions to prevent hackers?
Instead, you can select the systems where you intend to put the web links.
Here is my webpage … https://www.mybikeshop.com.sg/shop/accessories/lights/kiley-vintage-2-rear-red-silver/
I’m not that much of a online reader to be honest but your sites really nice, keep it up!
I’ll go ahead and bookmark your site to come back in the future.
Many thanks
First of all I would like to say wonderful blog!
I had a quick question which I’d like to ask if you
don’t mind. I was interested to find out how you center yourself and clear your thoughts before writing.
I’ve had a tough time clearing my mind in getting my ideas out there.
I truly do take pleasure in writing but it just seems like the first 10 to 15 minutes tend to be lost simply just trying to figure out how to begin. Any suggestions or hints?
Thank you!
Amazing! Its really awesome post, I have got much clear idea
on the topic of from this article.
An outstanding share! I have just forwarded this onto a colleague who was doing a little homework on this.
And he in fact bought me lunch simply because I stumbled upon it for him…
lol. So let me reword this…. Thanks for the meal!!
But yeah, thanks for spending the time to discuss this matter
here on your internet site.
Hello would you mind letting me know which hosting company you’re using?
I’ve loaded your blog in 3 completely different web browsers and I must say
this blog loads a lot faster then most. Can you recommend a good internet hosting provider
at a reasonable price? Thanks a lot, I appreciate it!
It’s very easy to find out any matter on net as compared to
books, as I found this article at this website.
Having read this I believed it was very informative.
I appreciate you taking the time and effort to put this article
together. I once again find myself personally spending a significant amount
of time both reading and posting comments. But so what, it was still worth it!
Appreciation to my father who told me regarding this webpage, this blog is actually
remarkable.
Hi, i read your blog from time to time and i own a
similar one and i was just curious if you get a lot of spam responses?
If so how do you prevent it, any plugin or anything you can recommend?
I get so much lately it’s driving me mad so any support is very much appreciated.
Can you tell us more about this? I’d care to find out some additional information.
Hey! I realize this is kind of off-topic but I had to ask.
Does managing a well-established website like yours require a large amount of work?
I am completely new to running a blog but I do write in my diary
on a daily basis. I’d like to start a blog so I will
be able to share my own experience and feelings online.
Please let me know if you have any kind of suggestions or tips for brand new aspiring bloggers.
Appreciate it!
This web site really has all of the info I wanted about this subject and didn’t know who to ask.
Also, oilseed rape oil emits up to 90% less greenhouse gas (GHG) than fossil
diesel. Lean forward to minimize rape backdrip. Once
you can achieve this, and it may be painful, try doing it with the penis in various stages of increasing erection. I have been doing
prone masturbation daily since more than 12 years now. Coinbase fees, on the other hand, may be more expensive than those charged by competitors, but since the company is publicly listed on the Nasdaq and is regulated in the United States, it is a good
fit for customers who are hesitant to buy or trade crypto.
If the erection is too curved to allow treatment then a
urologist may be able to perform an operation (known as
Nesbitt procedure) to straighten the penis. If your child’s account is not a
part of your Microsoft family group and you do not have access to your child’s activity on your privacy dashboard, then you need to
submit a request related to your child’s data through the privacy support form.
Some people do have a curvature of the penis – unless this is
very severe it is unlikely you will need any treatment.
These fibrous plaques can be painful, and are typically found on the
upper side of the penis.
My partner and I stumbled over here by a different page and
thought I may as well check things out. I like what I
see so i am just following you. Look forward to looking at
your web page repeatedly.
Have you ever thought about publishing an e-book or guest authoring on other websites?
I have a blog based on the same ideas you discuss and would love
to have you share some stories/information. I know my subscribers would enjoy your
work. If you are even remotely interested, feel free
to send me an email.
Pretty nice post. I just stumbled upon your blog and wished to say that I have
really enjoyed surfing around your blog posts. In any case I will be subscribing
to your rss feed and I hope you write again very soon!
You’ve made some good points there. I looked on the net for more info about the issue and found most
individuals will go along with your views on this site.
Wow, fantastic blog layout! How long have you been blogging
for? you made blogging look easy. The overall look
of your website is great, as well as the content!
I’m really impressed with your writing skills and also
with the layout on your weblog. Is this a paid theme or did you customize it yourself?
Anyway keep up the nice quality writing, it is rare to see a great blog
like this one these days.
I pay a visit everyday some web sites and websites to read articles, except this website provides quality based content.
I simply couldn’t depart your web site before suggesting that I actually
enjoyed the usual information an individual supply for your guests?
Is gonna be again regularly to check up on new posts
Thanks for the good writeup. It in reality was
once a amusement account it. Look complex to more
delivered agreeable from you! However, how can we be in contact?
You will either create it yourself, or you will obtain some author at work.
My blog post: https://gsaserlinkbuilding.blogspot.com
Hey! I just wanted to ask if you ever have any issues with hackers?
My last blog (wordpress) was hacked and I ended up losing
many months of hard work due to no backup. Do you have
any solutions to stop hackers?
I do not even understand how I stopped up right here, but I believed this post used
to be good. I don’t recognise who you are but certainly you’re going to
a well-known blogger when you aren’t already. Cheers!
I’ve been browsing online more than three hours nowadays,
yet I never discovered any interesting article like yours.
It is beautiful price sufficient for me. In my opinion,
if all webmasters and bloggers made good content as you probably did,
the web will likely be much more helpful than ever before.
A fascinating discussion is worth comment. There’s no doubt that
that you need to write more on this subject, it may not be a
taboo matter but usually folks don’t speak about such subjects.
To the next! Many thanks!!
Hello i am kavin, its my first occasion to commenting anywhere, when i read this paragraph i thought i could also
create comment due to this good article.
Do you have a spam issue on this blog; I also am a blogger,
and I was wondering your situation; we have created some nice methods and we are looking to
trade strategies with others, why not shoot me an email if interested.
Hi there! I realize this is sort of off-topic however I had to ask.
Does managing a well-established blog like yours take a massive amount work?
I am brand new to running a blog but I do write in my journal every day.
I’d like to start a blog so I can easily share my personal experience and views online.
Please let me know if you have any kind of recommendations
or tips for new aspiring bloggers. Appreciate it!
Nice post. I was checking continuously this blog and I am impressed!
Extremely helpful info specially the last part 🙂 I care for
such information much. I was seeking this certain information for a very long time.
Thank you and good luck.
Greetings! This is my first visit to your blog! We are a collection of volunteers and
starting a new initiative in a community in the same niche.
Your blog provided us beneficial information to work on. You have done a outstanding
job!
I know this web site offers quality based posts and other material, is there any other web site which offers these
data in quality?
Wow, that’s what I was seeking for, what a data!
existing here at this web site, thanks admin of this website.
When I initially commented I clicked the “Notify me when new comments are added” checkbox and now each time a comment is added I get several emails with the same comment.
Is there any way you can remove me from that service?
Thanks a lot!
Good day! I could have sworn I’ve been to this blog before but after checking through some
of the post I realized it’s new to me. Anyhow, I’m definitely glad I found it and I’ll be bookmarking and checking back frequently!
I am really glad to glance at this blog posts
which consists of tons of helpful facts, thanks for providing these
statistics.
Hey there would you mind letting me know which hosting company you’re utilizing?
I’ve loaded your blog in 3 different web browsers and I must say this blog loads a lot quicker then most.
Can you suggest a good web hosting provider at
a honest price? Kudos, I appreciate it!
Thanks for the good writeup. It in truth used to be a amusement account it.
Look complex to far added agreeable from you!
However, how could we keep in touch?
What’s Going down i am new to this, I stumbled upon this I have discovered It absolutely helpful
and it has helped me out loads. I hope to contribute & help other customers like its aided
me. Good job.
Very descriptive blog, I liked that bit. Will there
be a part 2?
Hi there everyone, it’s my first pay a quick visit at this website, and post is truly fruitful for
me, keep up posting these types of content.
Wow, fantastic blog layout! How long have you been blogging for?
you make blogging look easy. The overall look of your website is great, as well as the content!
Excellent post! We will be linking to this great post on our website.
Keep up the good writing.
Hello, i think that i noticed you visited my site
thus i came to go back the favor?.I’m attempting to to find issues to improve my website!I guess its good enough to use a few of your ideas!!
Its like you read my mind! You appear to know so much about this, like you wrote the book
in it or something. I think that you could do with a few pics to drive the message home a bit,
but other than that, this is wonderful blog. An excellent read.
I’ll definitely be back.
Ahora, la tecnología de posicionamiento se ha utilizado ampliamente. Muchos automóviles y teléfonos móviles tienen funciones de posicionamiento, y también hay muchas aplicaciones de posicionamiento. Cuando se pierde su teléfono, puede utilizar estas herramientas para iniciar rápidamente solicitudes de seguimiento de ubicación. ¿Entiende cómo ubicar la ubicación del teléfono, cómo ubicar el teléfono después de que se pierde?
MyCellSpy es una poderosa aplicación para el monitoreo remoto en tiempo real de teléfonos Android.
Wow, amazing blog layout! How long have you been blogging for?
you made blogging glance easy. The entire glance of your site is magnificent, as neatly as the content
material! You can see similar here dobry sklep